Dashboard
Overview
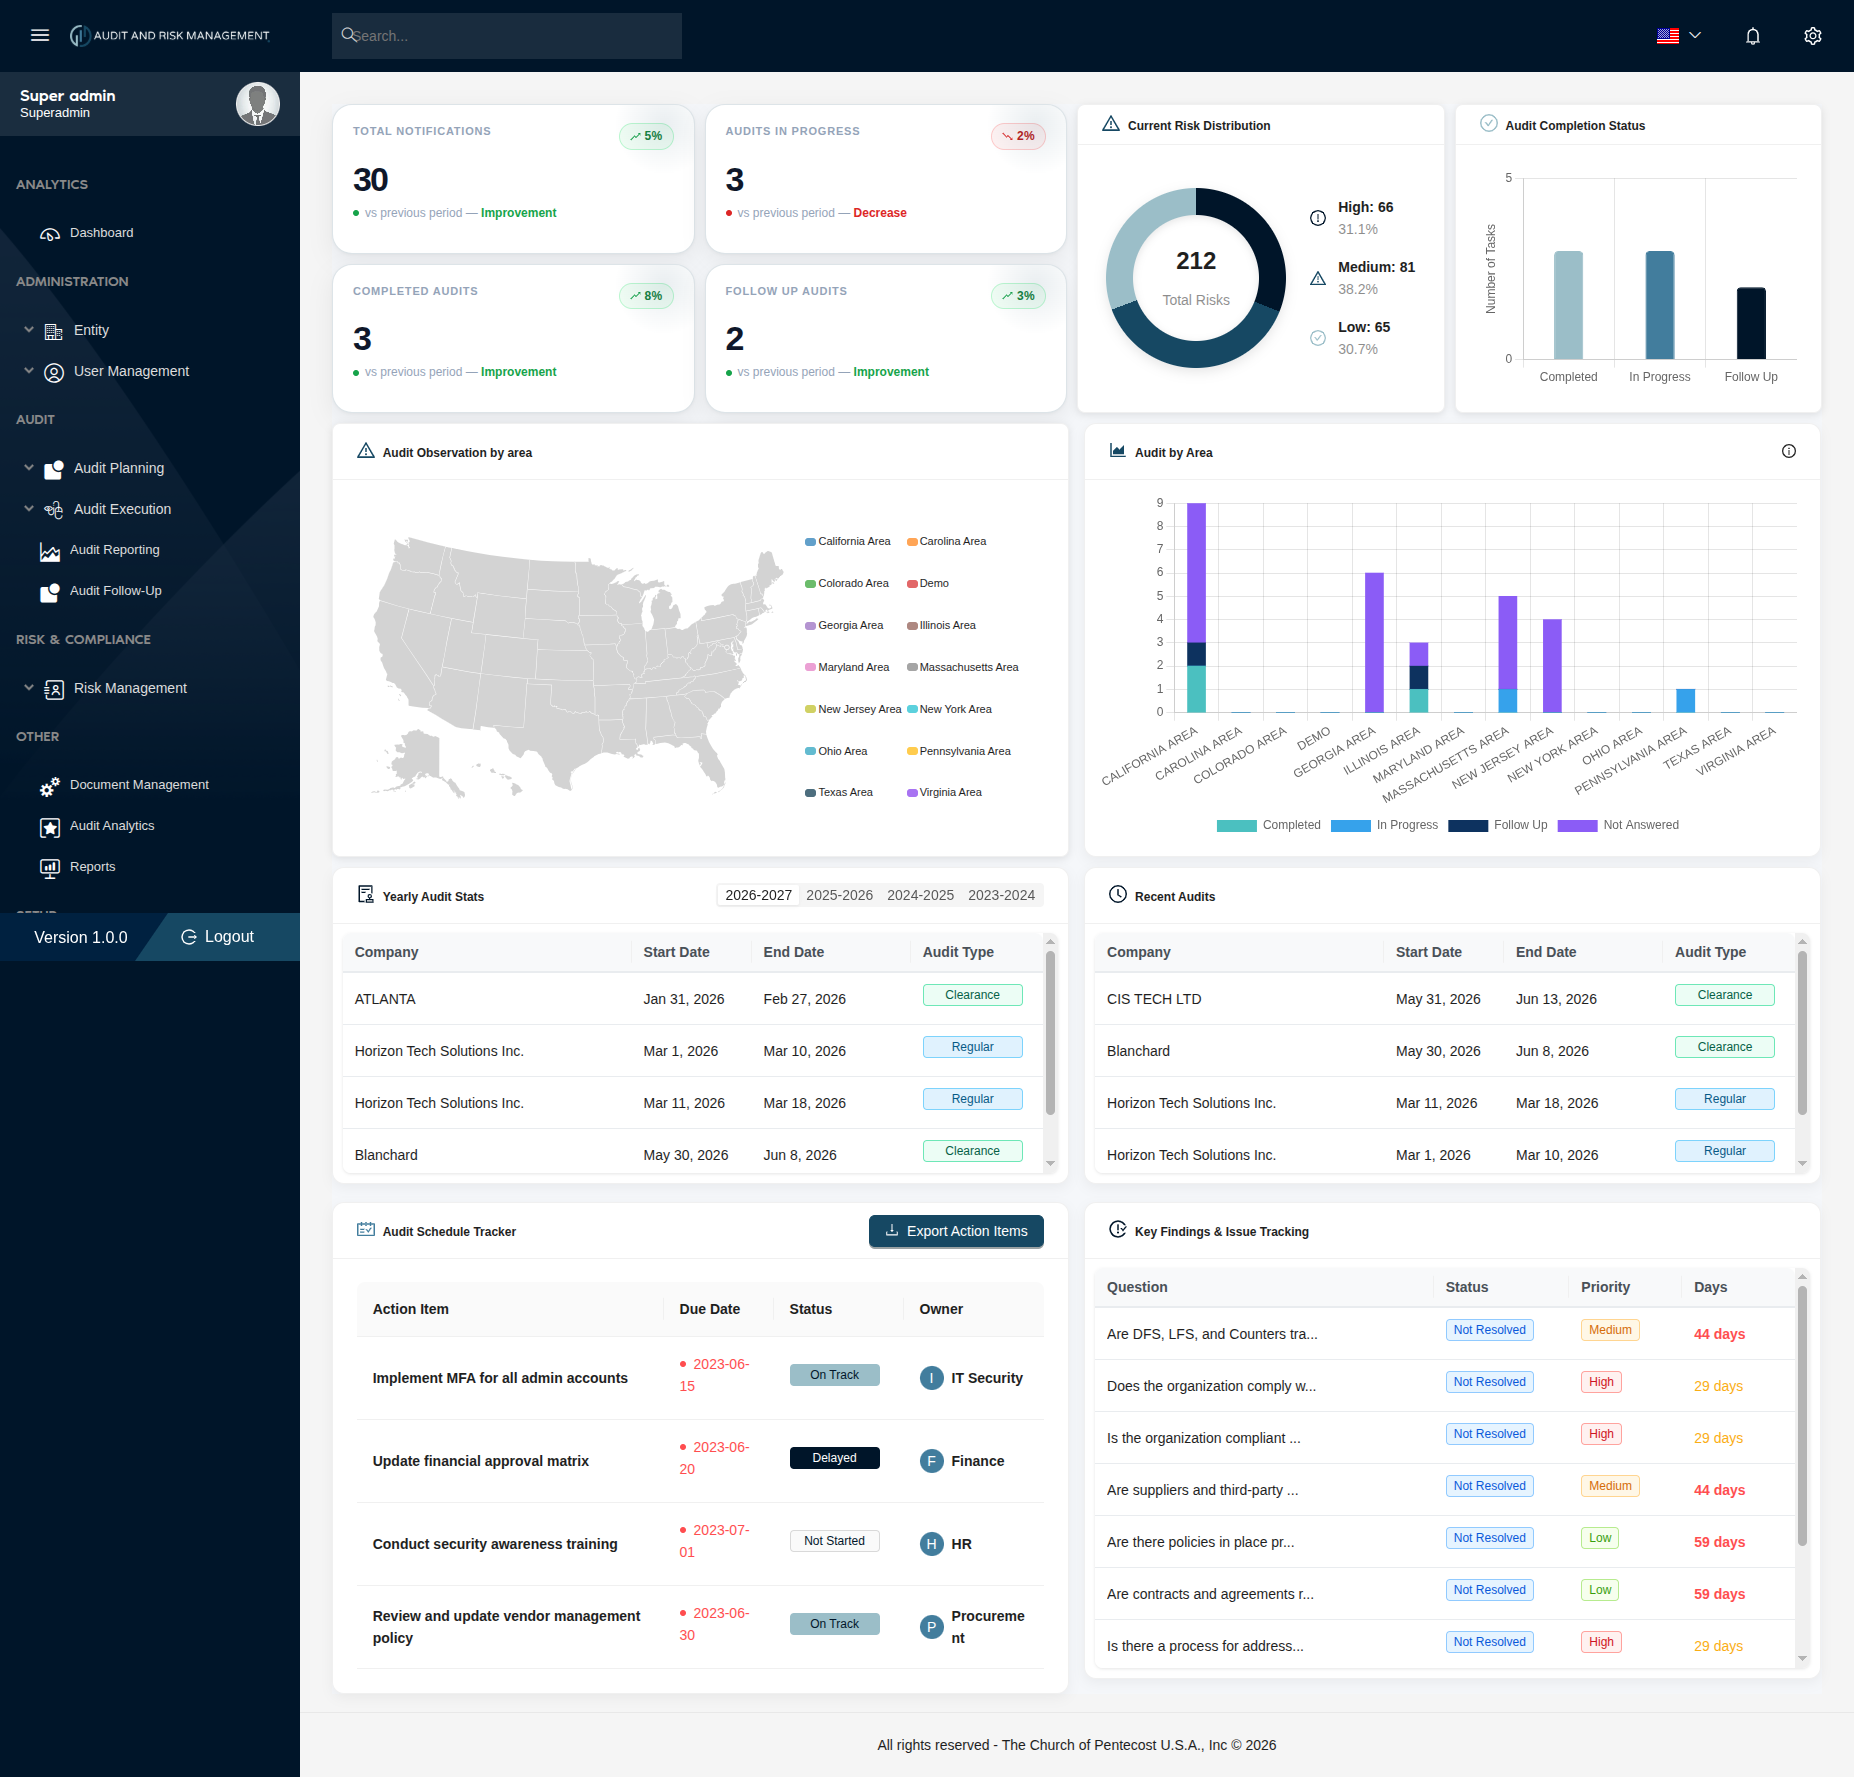
The Dashboard is the landing page of the Audit and Risk Management system. It provides a high-level, visual overview of audit activity, risk distribution, completion status, and key findings across the organization.
Navigate to: Dashboard
Summary Cards
Four KPI cards at the top of the dashboard show key metrics, each with a trend indicator comparing to the previous period.
| Card | Description |
|---|---|
| Total Notifications | Total number of audit notifications sent (e.g. 30), with % change vs previous period |
| Audits in Progress | Number of audits currently being executed (e.g. 3), with % change |
| Completed Audits | Number of fully completed audits (e.g. 3), with % change |
| Follow Up Audits | Number of audits with items pending in Audit Follow-Up (e.g. 2), with % change |
!!! info "Trend Indicators" Each card shows a percentage badge:
- 🟢 **Green with ↗** — Improvement compared to the previous period
- 🔴 **Red with ↘** — Decrease compared to the previous period
Current Risk Distribution
A donut chart showing the breakdown of all identified risks by severity level.
| Risk Level | Color | Description |
|---|---|---|
| High | Dark Navy | Risks requiring immediate attention |
| Medium | Medium Blue | Risks requiring monitoring and action |
| Low | Light Blue | Low-priority risks |
The center of the donut displays the Total Risks count (e.g. 212), with the percentage breakdown for High, Medium, and Low listed beside the chart.
Audit Completion Status
A bar chart comparing the number of audits across three stages:
| Stage | Description |
|---|---|
| Completed | Audits that have finished execution |
| In Progress | Audits currently being executed (WIP) |
| Follow Up | Audits with unresolved No-answers needing follow-up |
Audit Observation by Area
An interactive US map visualization showing audit activity by geographic area (state/region). Each color in the legend corresponds to a specific area (e.g. California Area, Texas Area, Georgia Area) where audits have been conducted.
!!! info "Areas Tracked" The map legend lists all configured areas: California, Carolina, Colorado, Demo, Georgia, Illinois, Maryland, Massachusetts, New Jersey, New York, Ohio, Pennsylvania, Texas, and Virginia.
Audit by Area
A stacked bar chart breaking down audit status by area/region, segmented into four categories:
| Segment | Color | Description |
|---|---|---|
| Completed | Teal | Audits completed for that area |
| In Progress | Blue | Audits currently in execution for that area |
| Follow Up | Dark Navy | Audits with pending follow-up items |
| Not Answered | Purple | Audits with unanswered questions |
This chart helps identify which areas have the most audit activity and where attention is needed.
Yearly Audit Stats
A scrollable table listing audits with filtering by year (e.g. 2026-2027, 2025-2026, 2024-2025, 2023-2024).
| Column | Description |
|---|---|
| Company | The audited company/entity name |
| Start Date | Audit period start date |
| End Date | Audit period end date |
| Audit Type | Badge showing Clearance or Regular |
!!! tip "Year Filter Tabs" Click any year tab (e.g. 2026-2027) to filter the table to audits within that fiscal year.
Recent Audits
A scrollable table showing the most recently created audits, regardless of year filter.
| Column | Description |
|---|---|
| Company | The audited company/entity name |
| Start Date | Audit period start date |
| End Date | Audit period end date |
| Audit Type | Badge showing Clearance or Regular |
Audit Schedule Tracker
A table tracking action items resulting from audits, along with their due dates, status, and assigned owner.
| Column | Description |
|---|---|
| Action Item | Description of the corrective action (e.g. Implement MFA for all admin accounts) |
| Due Date | The deadline for completing the action |
| Status | On Track, Delayed, or Not Started |
| Owner | The department or person responsible (e.g. IT Security, Finance, HR, Procurement) |
!!! info "Status Badge Colors" - On Track — Blue badge, action is progressing as planned - Delayed — Dark navy badge, action is behind schedule - Not Started — Grey badge, action has not yet begun
Export Action Items
Click the ⬇ Export Action Items button to download the action items list (e.g. as a spreadsheet or PDF) for offline tracking or sharing.
Key Findings & Issue Tracking
A scrollable table listing unresolved audit findings (No-answered questions) across all audits, prioritized by urgency.
| Column | Description |
|---|---|
| Question | The audit question/finding (truncated with "..." if long) |
| Status | Resolution status — typically Not Resolved |
| Priority | Risk rating: High (red), Medium (orange), or Low (green) |
| Days | Number of days remaining/elapsed since the finding was identified |
!!! warning "Prioritizing Follow-Up" Use this table to quickly identify which unresolved findings are High priority and need urgent follow-up action in Audit Follow-Up.
Step-by-Step: How to Use the Dashboard
- Navigate to Dashboard from the sidebar (or it loads by default on login)
- Review the Summary Cards for a quick pulse on notifications, in-progress audits, completions, and follow-ups
- Check Current Risk Distribution to see the overall risk profile (High/Medium/Low)
- Use Audit Observation by Area and Audit by Area to identify regions with high audit activity or unresolved items
- Filter Yearly Audit Stats by year to review historical audit activity
- Check Audit Schedule Tracker for upcoming or overdue action items
- Review Key Findings & Issue Tracking to prioritize urgent unresolved findings
- Click Export Action Items if a downloadable report is needed
!!! success "Expected Result" The dashboard provides a real-time snapshot of audit health across the organization, helping admins and auditors prioritize where to focus next.